
This blog post is about PlateyPlatey, a webapp I am developing to solve the (quite specific) problem I outline in this blog post. PlateyPlatey is in the very early prototype stages of development. I am having fun seeing how far I can develop it. If it saves even one researcher from the complete ballache of reorganizing research data, I will be ecstatic.
Once upon a time, I was a lab researcher. Boy, was it fun. This one time, I spent a month trying to crystallize a particularly annoying-to-crystallize molecule only to find that a decent proportion of the batch I was working with was actually silicone grease which, consequently, made crystallization impossible. Another time, my wrist twitched midway through adding LiAlH powder to a reaction and I managed to fill an entire schlenk line and vacuum pump with a mixture of corpse-scented phosphine and hazardous LiAlH powder. I now can’t smell phosphines without vomiting - fun.
Clearly, I wasn’t a particularly good synthetic researcher. This is probably because I get jittery when faced with anything that lacks a console or a robotic arm (take note, ladies). So, with that in mind, I reoriented my focus toward analytical and automation techniques.
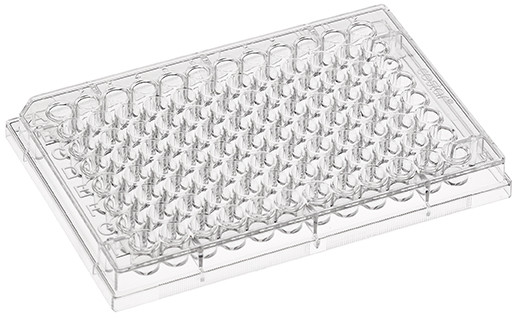
Boy, was it fun. This one time, I spent several long days hunched in a fume cupboard with a 96-well plate (below) in one hand and a multi-tipped pipette in another. In most experiments, I had to prepare enough of these plates to tile the roof of a small mansion.
After preparing the plates, I’d spend maybe another day or two reorganizing my plate’s data and input variables so that they could be imported into three different pieces of analysis equipment as run files. After the analysis was complete, I would then spend another day or two reorganizing the data into a format that worked with the analysis and visualization software I was using at the time.
After all that, I’d end up with—if I’m lucky—one line of a multiline plot. If the plot told an interesting or novel story (< 5 % of all plots) it might have ended up in the thesis, doomed to an eternity of sitting on a dusty hard-drive somewhere. If it was very interesting (< 0.1 % of all plots) it might have ended up in a journal - fun.
I was spending a lot of time preparing samples and rearranging data. Unfortunately, my samples couldn’t be prepared with our automated dispensers. However, when it came to data organization, the ball was in my court; accordingly, I invested a lot of time developing methods for linking sample and analytical data together.
My first approach followed the path of the programmer - “It’s all about the data structure!”. I designed a strictly-formatted excel spreadsheet. The spreadsheet layout was like something you’d get from an SQL query: each factor/variable was a column and each sample was a row (below). In that format, it’s very easy to filter and reorganize the data: most equipment, plotting software, and scripting languages are compatible with a row-oriented data structure. Further iterations of this design included unique sample ID generators, and helper sheets for re-joining data by ID.
| Well | Stirring Speed / rpm | Temperature / oC | Probability of working / % |
|---|---|---|---|
| A1 | 200 | 20 | 0 |
| A2 | 200 | 25 | 0 |
| A2 | 200 | 30 | 0 |
However, this design had problems. It wasn’t compatible with my—quite physical—mental model of a plate’s data. When I’m mid-back deep in a fume cupboard, I really didn’t like having to perform the following mental dialog each time I plated up a sample:
I’ve just pipetted 2 uL of my sample into row 2, column 3, of the plate and, uh, that’s row 27 in the excel sheet because it rearranges the plates row by row and it’s column 3 in the excel sheet because that’s the column I’m putting sample amounts in. Ok! Next sample.
Overall, this design shortened the data management step at the cost of making the (already quite tedious) sample preparation step more tedious.
My next approach followed the path of the designer. I designed a spreadsheet that lays out information in a plate-like layout and, using formulas, translated the data into a standard row-oriented spreadsheet. This was a direct mapping of the physical world (a plate) to the datastructure (a table).
This was much easier for to use, however it was quite hacky—VBA isn’t my personal weapon of choice—and it had several shortfalls:
- Some control was sacrificed by using VBA/excel rather than a general-purpose programming language. UX was especially impacted. For example, I couldn’t find a clean way to translate selection logic across plates & tables such that it was maintained as I moved between those formats.
- The plate-to-table translation was one-way. Users were expected to input data into a plate and formulas were used to translate it to the appropriate cell in the table. User’s couldn’t directly import the data in a tabular form and then manipulate it as a plate. Making it two-way would require even more VBA hacking.
- Each “plate” (or, in effect, “column”) occupied an individual sheet in the workbook. Therefore, there was a lot of sheet switching occurring when moving between plates/columns.
- Because it’s excel, it only really works for tabular arrangements of samples. Circular/carousel sample racks—which are more popular than you’d guess—don’t work well in it.
Even with those shortfalls, though, the excel workbook mostly served its purpose and I used various iterations of it throughout my PhD. I didn’t look back at it. Since then, though, I have worked around several other academic and industrial labs to find a worrying pattern: a lot of research groups have followed a similar path.
Apart from finding out that, no, I am not a special snowflake for creating a custom excel workbook, I found a potential gap in the software landscape - how exciting.
So, under the (potentially mistaken) belief that other people might find it useful, I decided to try and do a proper job of translating between physical (i.e. plate) and “ideal” (i.e. tabular) layouts in a UI. I even thought up an amazingly imaginative name—PlateToTable—for the product. However, Jane Whittaker thought it sounded like a restaurant, so I eventually settled on PlateyPlatey after it won out over PlateyMcPlateFace.
PlateyPlatey is a webapp that lets you select wells in a plate layout and then assign values to those wells by typing stuff in. It’s currently in the very early stages—it’s essentially a proof-of-concept at the moment—but there are several key design goals I’m trying to stick to:
- It should be easy to get the tabular data out of the app and into other table-based tools (Excel, Libreoffice Calc, etc.).
- There should be a clear association between the plate layout and the table layout.
- It should be easy to select (patterns of) wells/rows
- It should be easy to configure new physical layouts. Plate configurations should be provided declaratively.
- Rearranging data should be easy.
- It shouldn’t assume one particular UI design: users should be able to configure the appearance, layout, keybinds, and behavior of PlateyPlatey to suit their needs.
The last one has proven particularly difficult to aim toward. However, I am quite happy with how far it’s come along in the short amount of time dedicated to it (~2 months of weekends). I look forward to developing it further and, if you’re a frustrated lab worker who is sick to death of populating a plate, check it out. Even if you think it sucks—because in a lot of ways, it does suck at the moment—I’d really appreciate feedback on it.